 Gosset
 Market Analysis
Most of XBI's +78% is sector beta, not new money

As of June 23, 2026. Trailing-12m measured to the close of June 22, 2026. Informational only, not investment advice.
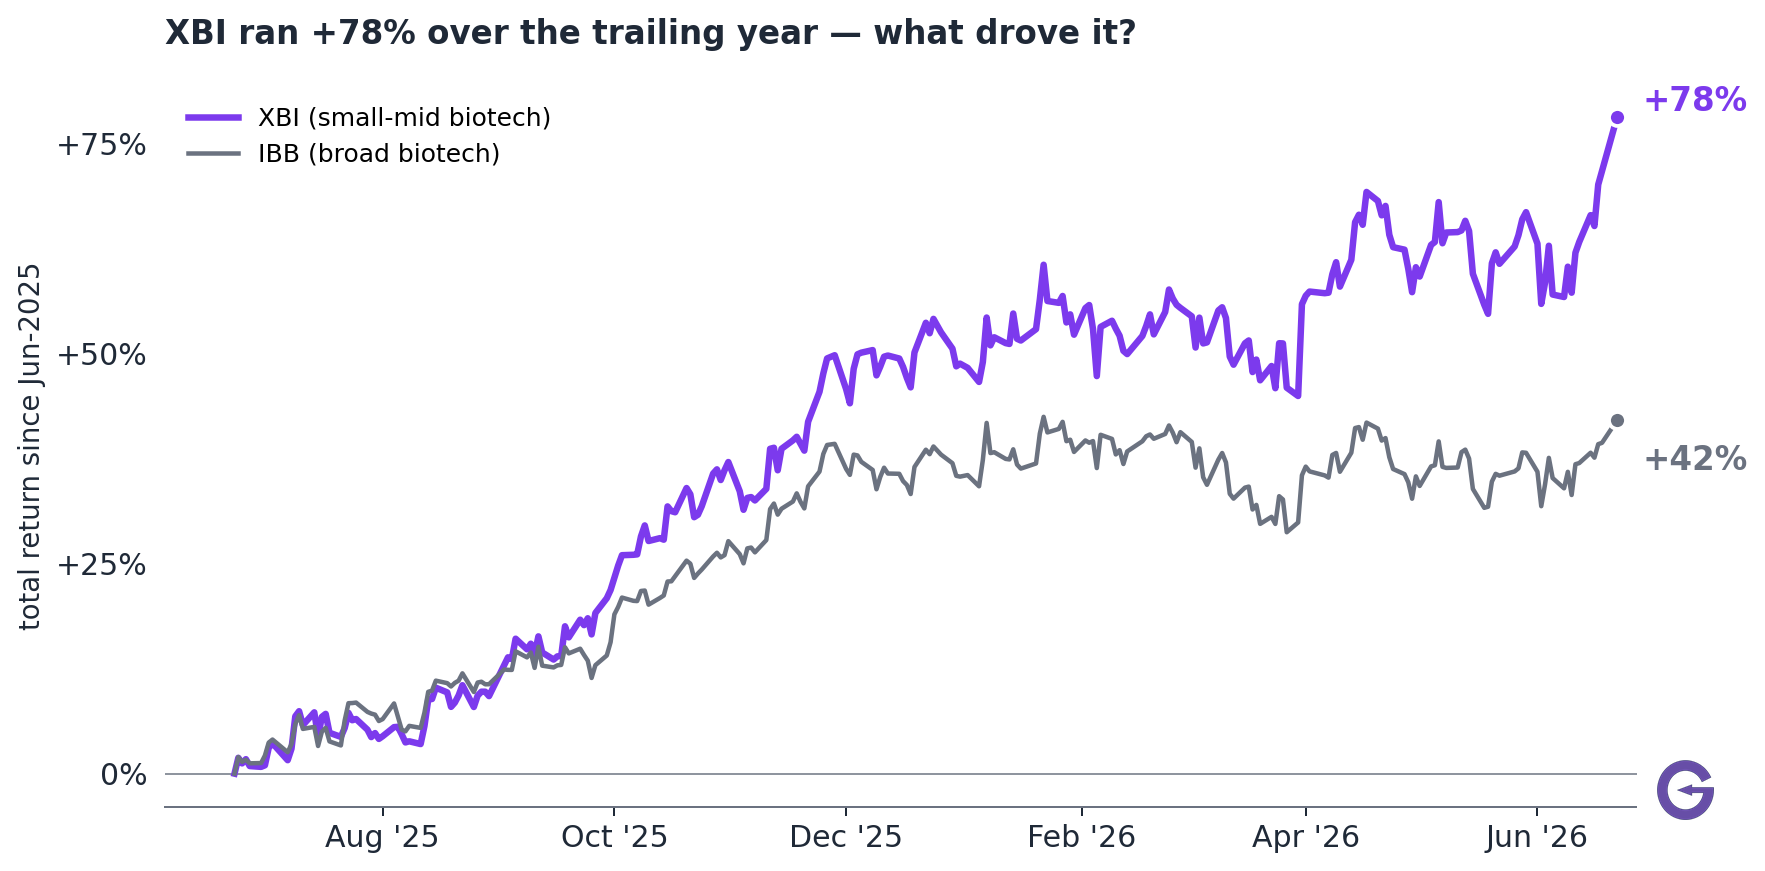
The biotech index (XBI, the equal-weighted basket of small and mid-cap biotech names) is up +78% over the trailing year, after −12% the year before. The number looks like external money rotating into biotech and re-rating the sector. The data does not support that reading. Most of the move is the broad biotech sector rising, with XBI geared on top of it.
Three results fall out of the decomposition:
- It's mostly the broad biotech sector moving up, amplified, not an independent re-rating. XBI moves about 1.35× the broad biotech index (IBB, +42%), and IBB itself was roughly two-thirds macro. Most of the +78% is the sector going up with XBI geared on top of it.
- The part genuinely specific to small-mid biotech is small. Depending on the specification, only 22% to 45% of the move is specific to small-mid biotech rather than the broader market.
- M&A is the one channel where external money clearly showed up. Biotech M&A dollars nearly doubled (+96% YoY to ~$190B), while primary issuance went the other way (IPOs and licensing both −31%). The re-rating is about the takeout bid, not a broad funding boom.
The broad index did most of the work
The broad biotech index (IBB, +42%) did most of the work. XBI is a geared version of the same trade. Day to day the two move together about 91% of the time (correlation +0.91), and XBI swings about 1.35× as hard as IBB. Before any biotech-specific factor enters, most of the +78% is IBB rising with XBI geared to it.
A two-stage decomposition
We split the move into two layers that match how the market stacks up: the macro economy, then the broad biotech sector, then small-mid biotech.
Stage A, what moved the broad biotech index (IBB)? Compare IBB against macro yardsticks (small-cap stocks IWM, healthcare XLV, the overall market SPY, bonds/rates TLT). Stage B, what moved XBI on top of IBB? Compare XBI against IBB, and read whatever is left over as the part specific to small-mid biotech.
Stage B: XBI is 1.35× IBB plus a small leftover
Once IBB is in the picture, the model explains 87% of XBI's day-to-day moves (up from 48% without it), and the broader-market yardsticks net to roughly zero. The +78% resolves into the amplified sector move plus a small leftover.
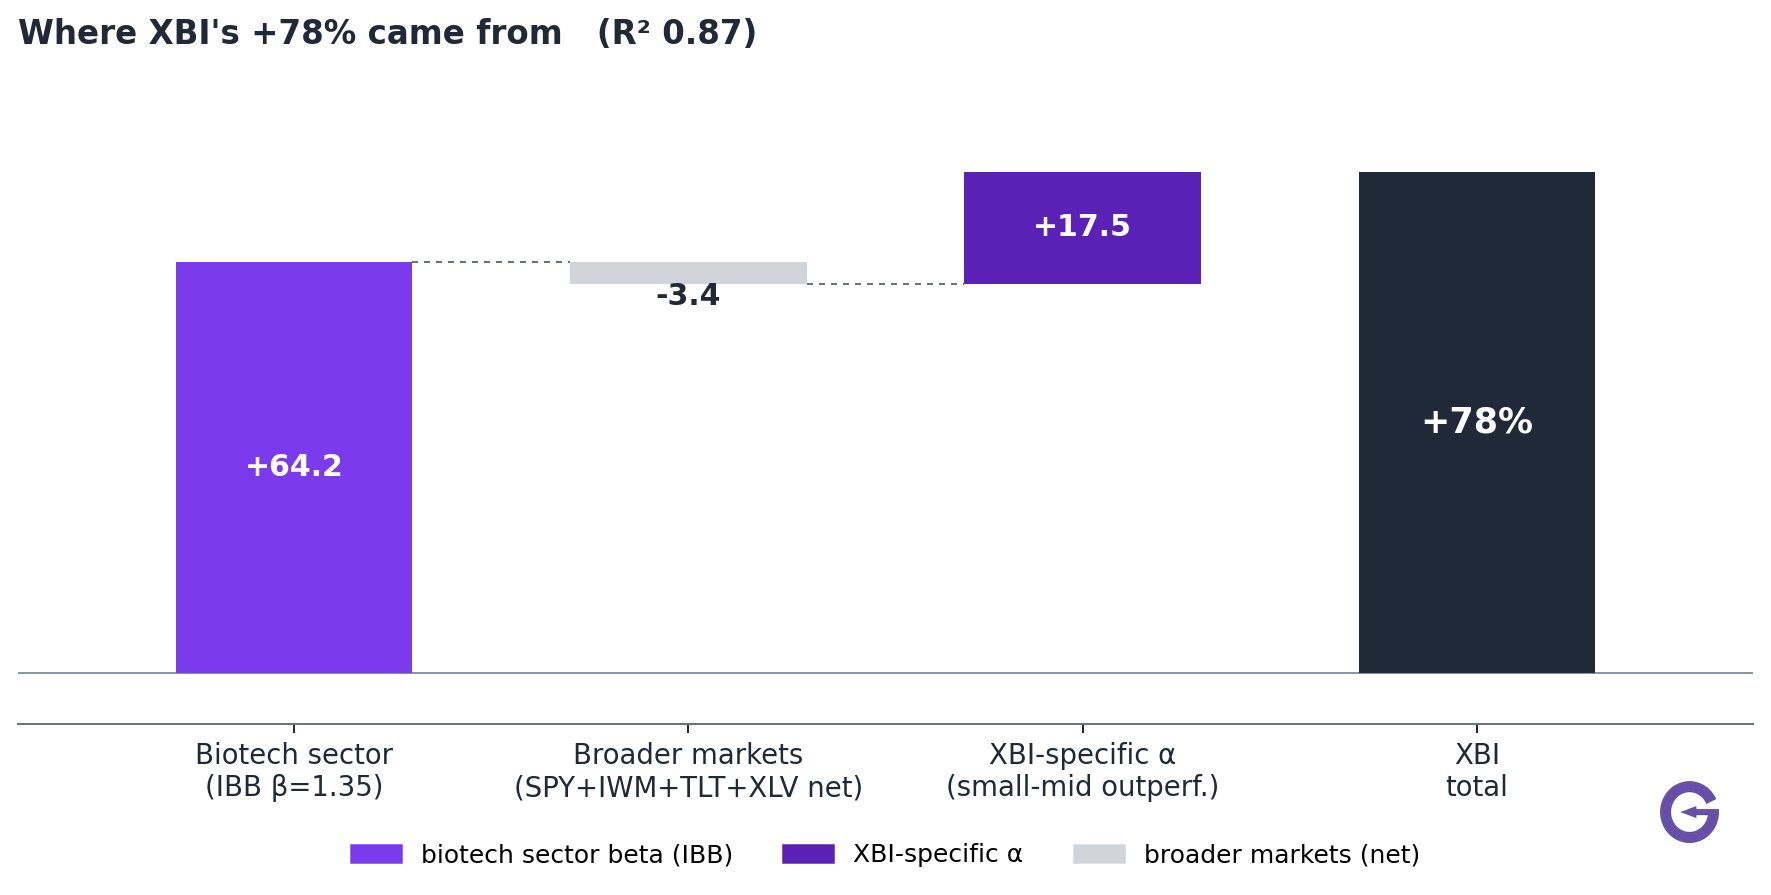
| Component | Contribution |
|---|---|
| Amplified biotech sector move (1.35× IBB's +42%) | +64pp (~72%) |
| Broader markets, net | ~ −3pp |
| XBI-specific (small-mid outperforming large-cap) | +17pp (~22%) |
Stage A: IBB's +42% is roughly thirds
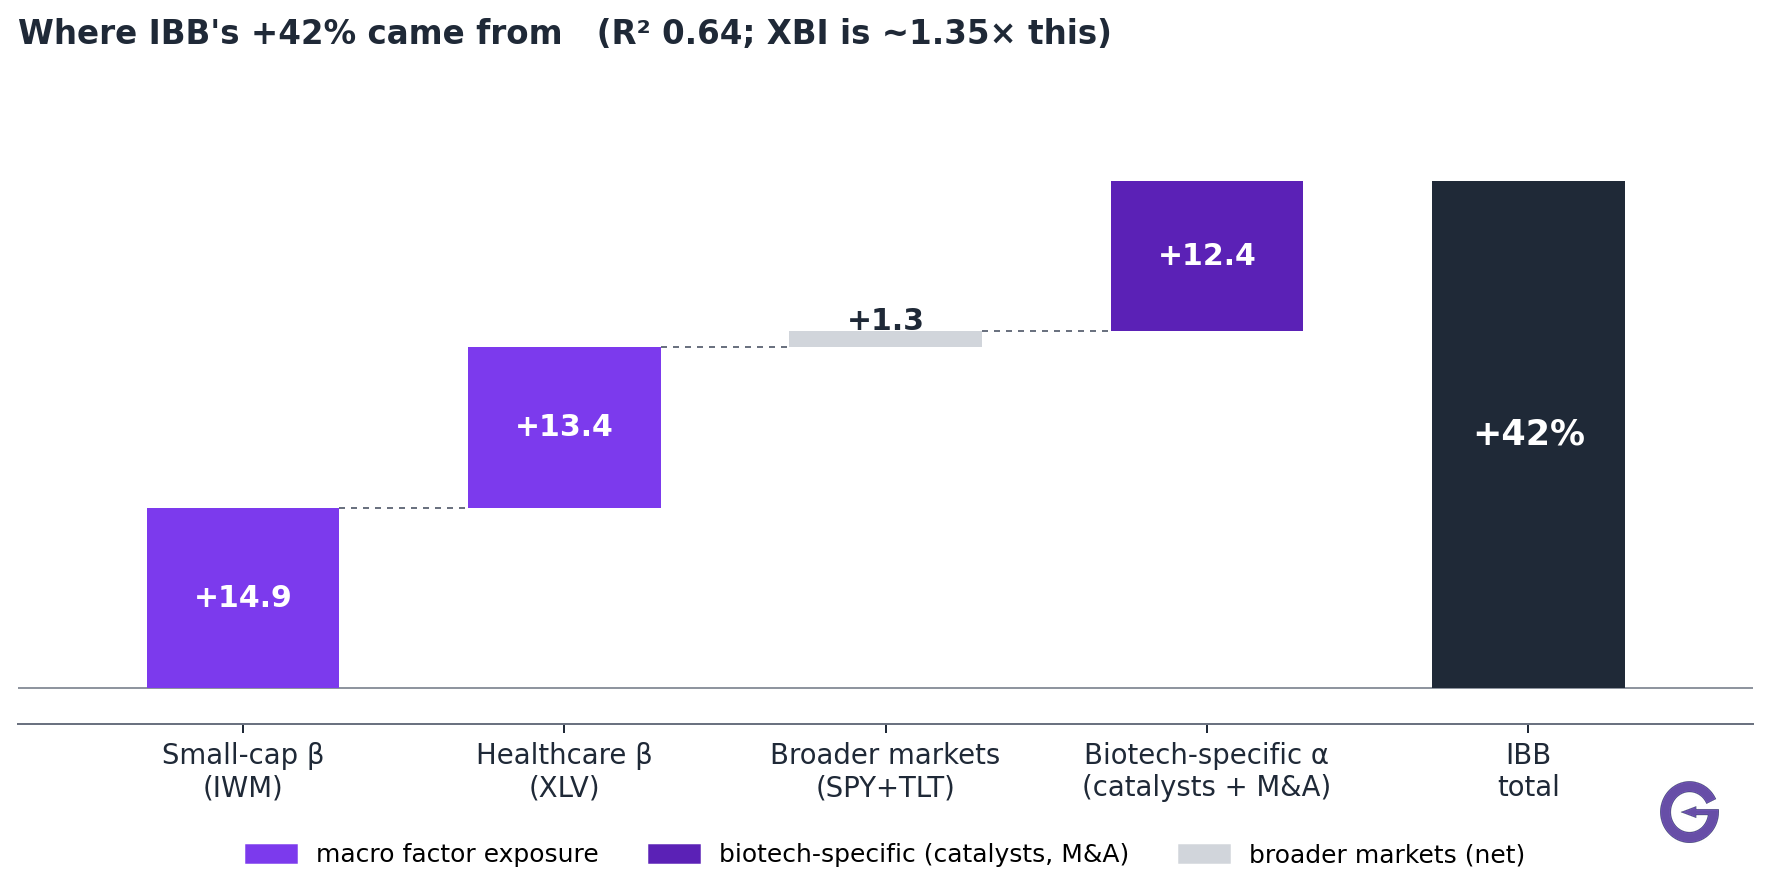
Comparing IBB against the macro yardsticks (the model explains 64% of its moves) splits its +42% into ~36% riding small-cap stocks (IWM), ~32% riding healthcare (XLV), and ~30% biotech-specific, the catalyst-and-M&A layer no macro yardstick captures.
 9-slide deck
Full presentation
See the full Most of XBI's +78% is sector beta, not new money deck
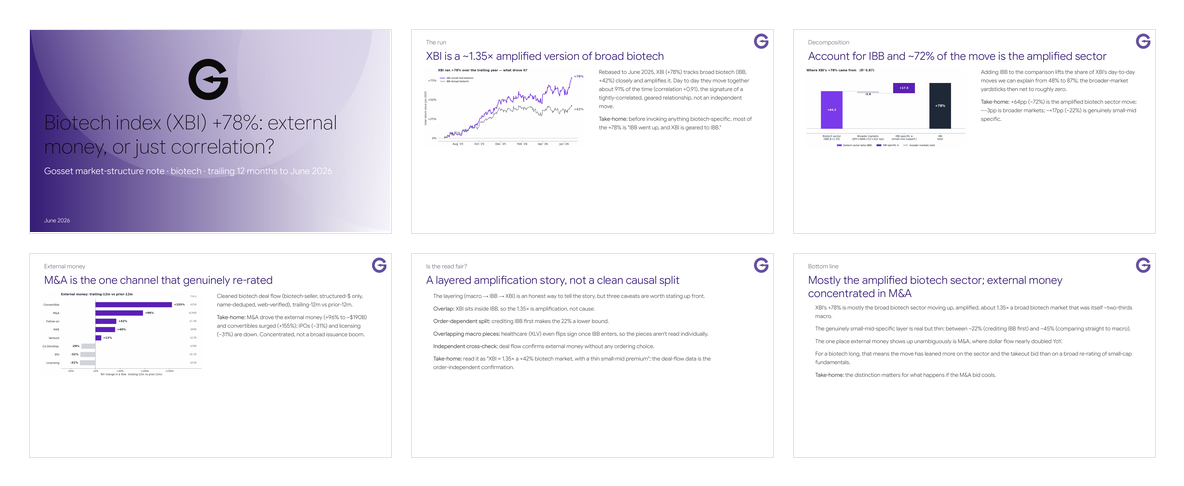
We’ll email you the link to the two-stage breakdown waterfalls, the deal-flow detail, and the methodology caveats, all 9 slides.
Three caveats to the decomposition
The layering (macro, broad biotech, small-mid biotech) keeps each driver separable instead of cramming everything into one model. Three caveats qualify it:
- XBI and IBB overlap. IBB isn't a truly separate thing, many XBI names sit inside it. So "XBI explained by IBB" is partly XBI explained by a basket that already contains XBI. That overstates how tightly they track and makes "IBB drives XBI" sound more causal than it is. The 1.35× is an amplification relationship, not a cause.
- The split depends on the order of attribution. Crediting IBB first hands all the shared biotech movement to IBB, leaving XBI only its leftover (the ~22%). Comparing XBI directly against macro instead raises that leftover to ~45%. Same data, different bookkeeping, so the 72/22 split is a lower bound on the biotech-specific share, not a point estimate.
- The individual macro pieces aren't cleanly separable (healthcare XLV's contribution even flips sign once IBB enters, because the yardsticks overlap), and we impose one constant relationship over a year that clearly had several distinct phases.
Read together, the result is a layered amplification: XBI is roughly 1.35× a +42% biotech market, with a small small-mid premium on top, not a precise causal split of every percentage point. The model is the headline; the deal-flow data below is an independent cross-check that does not depend on the attribution order.
Where the external money actually went
We cleaned biotech deal flow from our own deals database (biotech-seller only, structured-$ figures only, no text-parsed phantoms, name-deduped, and web-verified row by row) and compared the trailing 12 months against the prior 12.
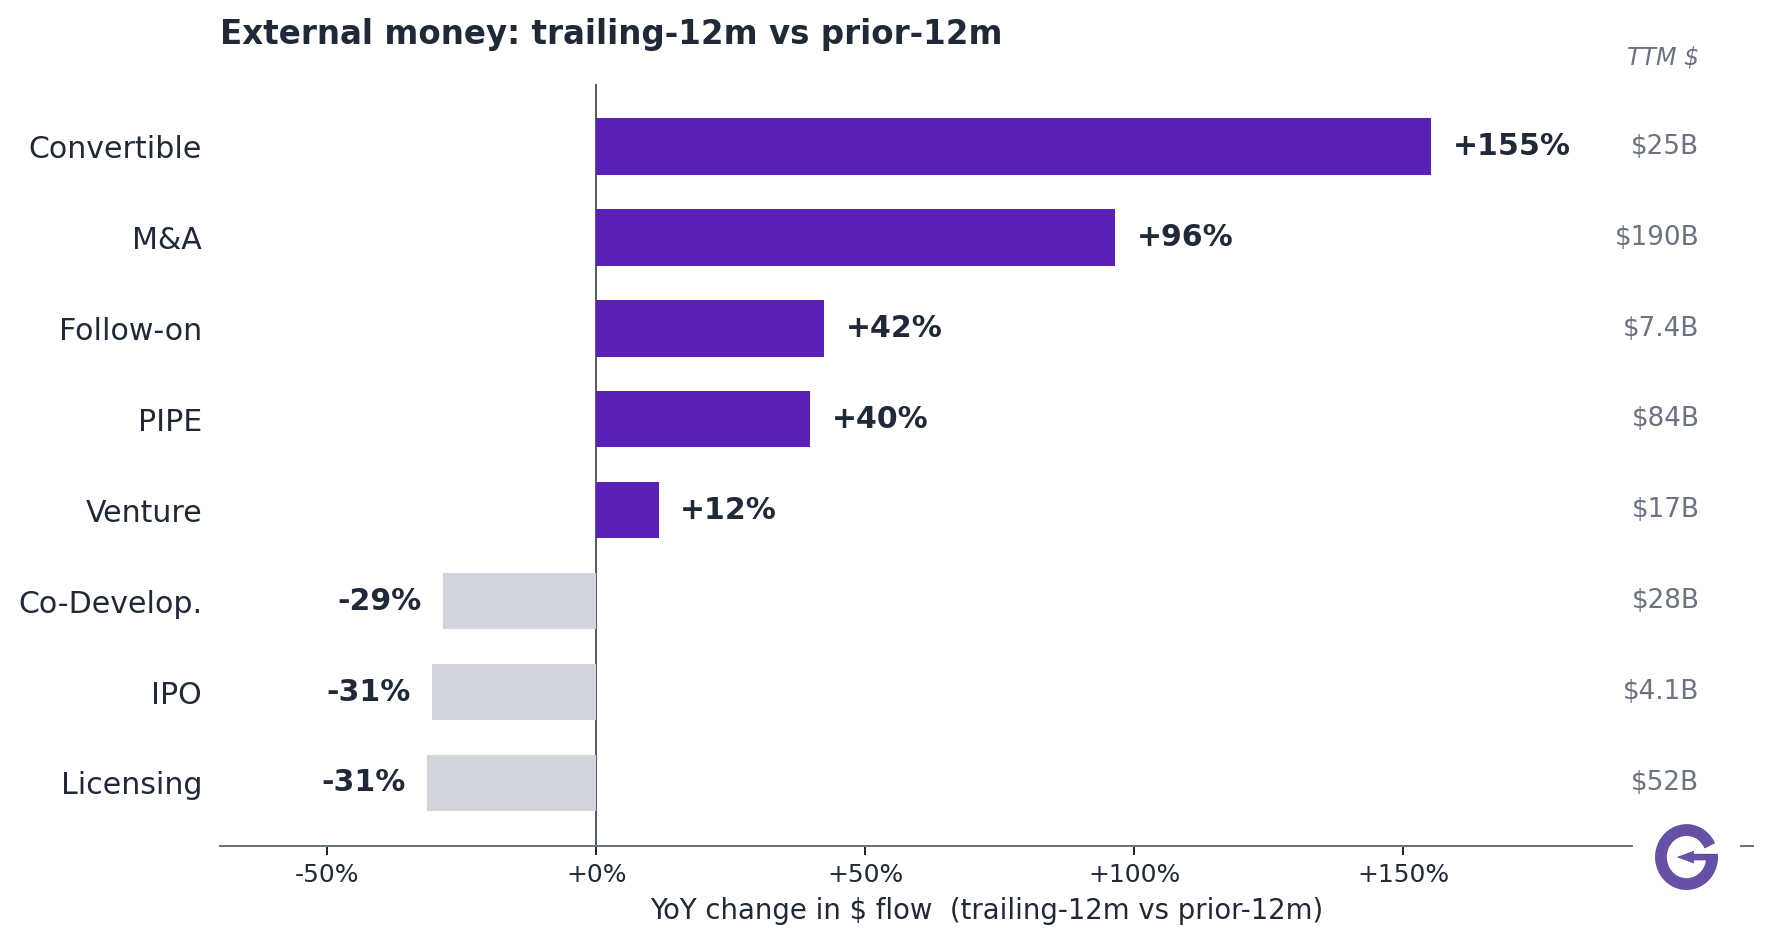
M&A is the dominant external-money channel, up +96% YoY to ~$190B, consistent with a re-rating that's partly about acquirers paying up. The risk appetite shows in the financing mix too: convertibles +155%, while IPOs −31% and licensing −31% are down. The "external money" thesis holds, but it's concentrated in M&A and structured financing, not a broad primary-issuance boom.
What this means for a biotech long
XBI's +78% is mostly the broad biotech sector rising, amplified: about 1.35× a broad biotech market (IBB) that was itself roughly two-thirds macro. The part genuinely specific to small-mid biotech runs between 22% (crediting IBB first) and 45% (comparing straight to macro). The one channel where "external money" shows up unambiguously is M&A, where dollar flow nearly doubled. The move has leaned more on the sector and the takeout bid than on a broad re-rating of small-cap fundamentals. Should the M&A bid cool, the principal support cools with it.
Method & data
- Factor model: daily-log-return OLS over the trailing 12 months; XBI/IBB and macro factors (SPY, IWM, TLT, XLV) from daily adjusted closes. Nested specification (IBB ~ macro; XBI ~ IBB) reported alongside the direct XBI ~ macro fit as a robustness check.
- Deal flow: Gosset deals database, biotech-seller deals with structured dollar terms, name-normalized de-duplication, trailing-12m vs prior-12m windows, manually web-verified for the top M&A rows.
- The full slide deck (factor waterfalls, deal-flow breakdown, and the methodology caveats) is available via the form above.